Pending and Committed Government Funding Programs
View areas of Missouri that have pending and/or committed government funding for broadband infrastructure expansion.
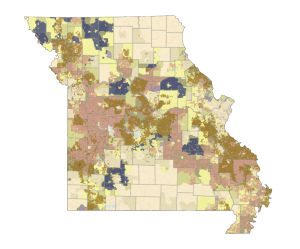
No Funding and No Broadband Service
View areas of Missouri that have not received federal funding for broadband projects and do not have adequate internet service (25/3 mbps).
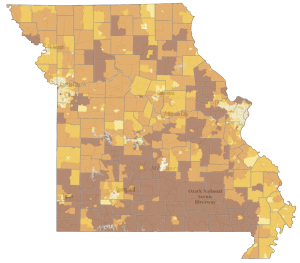
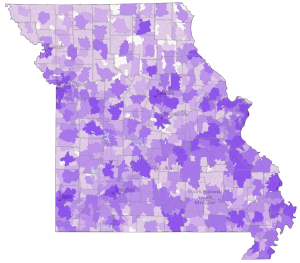
Broadband Service Providers
View the number of internet service providers by county, census tract, or block group.
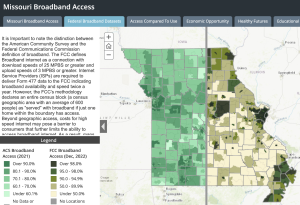
Missouri Broadband Access Story Map
The Missouri Broadband Access Story Map provides information about internet access across the state.
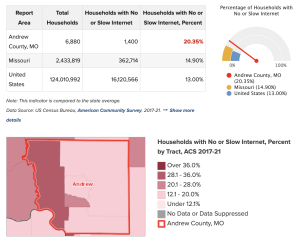
Broadband Needs Assessment
The Broadband Needs Assessment can help you find and explore needs and assets in your county or region.
Missouri Map Room
Visit the Missouri Map Room to access more than 28,000 data layers and learn more about your community.
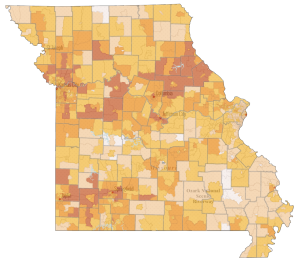
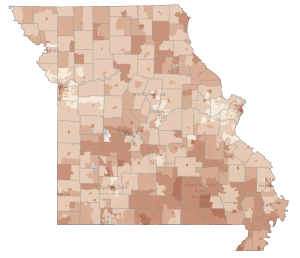
Broadband Cost Burdened Households at $100 per Month
This map shows the percent of households considered cost-burdened if internet services cost $100 per month.
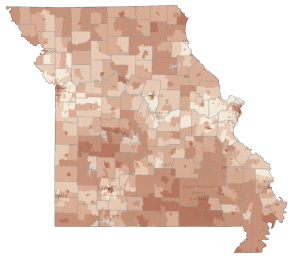
Broadband Cost Burdened Households at $50 per month
This map shows the percent of households considered cost-burdened if internet services cost $50 per month.
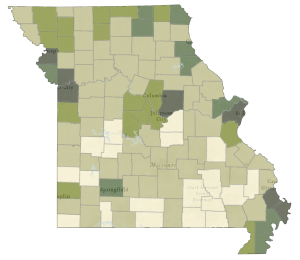
Broadband Cost Burdened Households at $75 per month
This map shows the percent of households considered cost-burdened if internet services cost $75 per month.
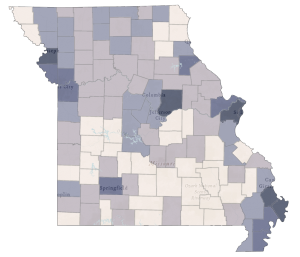
Broadband Cost Burdened Households at $150 per month
This map shows the percent of households considered cost-burdened if internet services cost $150 per month.
Broadband Access – FABRIC Locations, 25/3+ MBPS
View areas of Missouri where internet is available at speeds of at least 25/3 mbps.

Crucial Connectivity: Broadband Experiences of Missourians
This StoryMap illustrates the experiences captured in the Missouri Digital Inclusion Asset Mapping Focus Group Study. Learn more about the reality of broadband experiences for Missourians.
Broadband Access – FABRIC Locations, 100/20+ MBPS
View areas of Missouri where internet is available at speeds of at least 100/20 mbps.
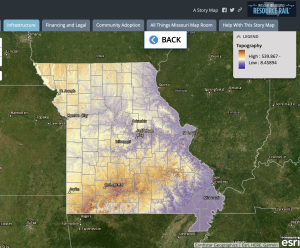
Broadband Planning Story Map
Use this story map to explore considerations for broadband expansion planning such as partnerships, topography, and population trends.
Households Enrolled in Emergency Broadband Benefits Programs
View the number of households enrolled in emergency broadband benefit programs.